|
Horizontal Stretch and Compress may, or may not, be studied in your Algebra 1 class.
We saw in Vertical Stretch or Compress, the "distorting" of the shapes of the functions.
The Horizontal Stretch or Compress will also change the shape of the function, but in a different direction. These "distorted" transformations will "push" and "pull" the graph horizontally.
What is the difference between a Vertical Stretch/Compress and a Horizontal Stretch/Compress?
• A vertical stretch/compress occurs when the function (the output, y)
is multiplied by a positive number. ("outside" the function)
• A horizontal stretch/compress occurs when the input (x)
is multiplied by a positive number. ("inside" the function)

| Dilation: Horizontal Stretch or Compress: f (k•x) |
 When the input values (x-values) of a function are When the input values (x-values) of a function are
multiplied by a positive constant, k,
a horizontal stretch, or compression, of the function will occur.
If the constant is greater than one (k > 1), a horizontal compression will occur.
If the constant is between 0 and 1 (0 < k < 1), a horizontal stretch will occur.
(FYI: If it appears that k is negative, you are looking at a horizontal stretch, or compress,
followed by a horizontal reflection (in the y-axis).
A horizontal stretch, or compress, will multiply all x-values by k.
The y-values will not change.
 NOTE: During a horizontal stretch, or compress, the y-intercept of the function NOTE: During a horizontal stretch, or compress, the y-intercept of the function
(where x = 0), never changes. The y-intercept stays attached to the y-axis.
|
A horizontal stretch, or compression,
transforms the "inside" (input values) of the function.
When changes to a function take place inside the parentheses, such as f (k•x),
a change occurs to the inputs. These types of changes can be difficult to understand.
Let's take a look at the quadratic parent function, f (x) = x2,
and see if we can figure out what is happening.
Horizontal Stretch:
f (k•x) where 0 < k < 1
" horizontal stretch by a factor of 1/k " |
Start with parent function f (x) = x2.
Let k = ½
If the starting x-coordinate is positive,
the horizontal stretch will move the new
x-coordinate further to the right of the y-axis.
If the starting x-coordinate is negative,
the horizontal stretch will move the new
x-coordinate further to the left of the y-axis.
Remember: The y-intercept value (where x = 0)
stays attached to the y-axis, and does not change.
A horizontal stretch "pulls" the graph horizontally
away from the y-axis (to the left and/or right).
|
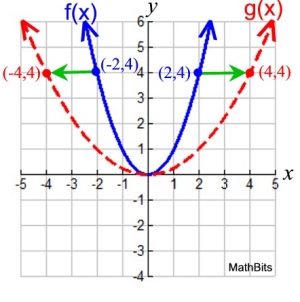
Given: f (x) = x2 and k = ½
Horizontal Stretch:
f (½ x) = (½ x)2
The new function can be renamed:
g (x) = (½ x)2
The y-intercept value (0,0) will not change.
|
|
Let's look at the coordinates for the two graphs.

(x, y) becomes (x/k, y)
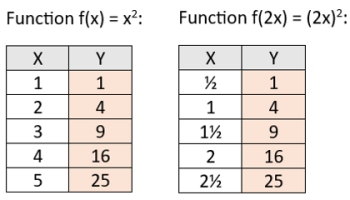
The tables above show the y-coordinates and their matching x-values for both functions.
|
Keep in mind that the y-values
will not be changed.
It's the x-values that will change.
To find the new x-values of the stretch,
to match the y-values from f (x),
multiply each x-coordinate by 1/k.
In the example at the left, the x-values from the parent function, f (x), are multiplied
by 1/k = 1/½ = 2
to obtain the x-values of the stretch. |
Horizontal Compress:
f (k•x) where k > 1
" horizontal compression by a factor of 1/k "
|
We are still working with
the
parent function f (x) = x2.
Let k = 2
If the starting x-value is positive,
the horizontal compression will keep the the new
x-coordinate positive, but closer to the y-axis.
If the starting x-value is negative,
the horizontal compression will keep the new
x-coordinate negative, but closer to the y-axis.
Remember: The y-intercept value (where x = 0)
stays attached to the y-axis, and does not change.
A horizontal compress "pushes" the graph horizontally
closer to the y-axis (from the left and/or right).
|
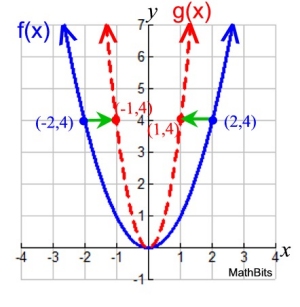
Given: f (x) = x2 and k = 2
Horizontal Compression:
f (2x) = (2x)2
The new function can be renamed:
g (x) = (2x)2
The y-intercept value (0,0) will not change.
|
|
Let's look at the coordinates for the two graphs.
(x, y) becomes (x/k, y)
The tables above show the y-coordinates and their matching x-values for both functions.
|
Keep in mind that the y-values for both graphs must be horizontally the same.
It's the x-values that will change.
To find the new x-values of the compress,
to match the y-values from f (x),
multiply each x-coordinate by 1/k.
In the example at the left, the x-values from the parent function, f (x), are multiplied
by 1/k = 1/2 = ½
to obtain the x-values of the stretch. |
S U M M A R Y
| Dilations of Functions: f (kx) |
Horizontal Stretch or Compression (Shrink)
f (kx) stretches/shrinks f (x) horizontally |
"For the new graph"
(x, y) becomes (x/k, y)
"horizontal dilation"
|
A horizontal stretching is the stretching of the graph away from the y-axis
A horizontal compression (or shrinking) is the squeezing of the graph toward the y-axis.
• if k > 1, the graph of y = f (k•x) is the graph of f (x) horizontally shrunk (or compressed) by multiplying each of its x-coordinates by 1/k (or by dividing each of its x-coordinates by k).
• if 0 < k < 1 (a fraction), the graph is f (x) horizontally stretched by multiplying each of its x-coordinates by 1/k (or by dividing each of its x-coordinates by k).
• if k should be negative, the horizontal stretch or shrink is followed by a reflection in the y-axis.
|
| Notice that the "roots" on the graph have now moved, but the "y-intercept" stays in its same initial position for all graphs. The graph gets "pushed and pulled" left and right from the locking y-intercept. The x-values change. The y-values do not change. |
 |
|

NOTE: The re-posting of materials (in part or whole) from this site to the Internet
is copyright violation
and is not considered "fair use" for educators. Please read the "Terms of Use". |
|
|