|
|
A measure of central tendency is a value that attempts to describe a set of data by identifying the central position of the set.
|
The most commonly used measures of central tendency are the mean, median and mode.
While the mean and median are used to find the approximate "center" of a set of data,
the mode is used to find the most "popular"
value in the data set.
Note: In Algebra 1, emphasis will be placed on mean and median.
 Finding Measures of Central Tendency: Finding Measures of Central Tendency: |
Mean (or average):
(n is the number of values in the data set) |
Median (middle):
(n is the number of values in the data set) |
• is the number found by adding all of the values in the data set and dividing by the total number of values in that set (finding the average of the data set).
mean = average
 Using summation notation:
  The mean is often thought of as the balance point of the data set.
Note: Do not round unless told to do so. Give full calculator result.
The mean is often thought of as the balance point of the data set.
Note: Do not round unless told to do so. Give full calculator result.
|
• is the middle number in an ordered data set.
The number of values that precede the median will be the same as the number of values that follow the median.
The median is a midpoint of the distribution.
To find the median:
1. Arrange the data into ascending (increasing) or descending (decreasing) order.
2. If n (the number of values in the data set)
is an odd number, the median is the middle value.
• If n is an even number, the median is the average of the two middle values.
Note: Think of the "median on the highway", which is in the "middle" of the road.
|
|
See how to use your TI-84+ family graphing calculator
with mean, mode, median
Click here. |
|

| Which Measure of Central Tendency is the Best Choice? |
Each of the measures of central tendency has "Pros" and "Cons".
Remember: An "outlier" is an extreme value that differs greatly from the other values in the set.
Data Set: {2, 5, 7, 4, 5, 8, 9, 1, 7, 4, 3, 6, 8, 4, 350} outlier = 350
|
"average" |
Use the mean to describe the most "typical" value of a set that does not have an outlier.
(An outlier is an extreme value that differs greatly from the other values in the set.).
• most popular measure in business,
engineering and computer science.
• yields one distinct answer.
• useful for comparing sets of data. |
• yields inflated or deflated result when extreme values (outliers) or skewed data are present. The mean has a tendency to be pulled toward extreme values. |
|
|
Use the median to describe the most "typical" value of a set that does have an outlier.
(An outlier is an extreme value that differs greatly from the other values in the set.)
|
• outliers (extreme values) or skewed data
do not affect the median as strongly as they affect the mean.
• yields one distinct answer.
• useful for comparing sets of data. |
• not as popular (or used as often) as the mean. |
|
Notice what happens to the Mean and Median when an "outlier" appears:
|
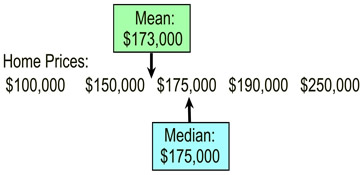
This graphic shows a listing of home prices arranged in ascending order. The mean and median are shown.
|
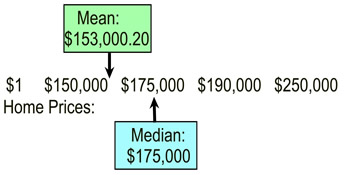 This graphic is the same as the one on the left, except the lowest price has been replaced with an
 outlier . The $100,000 home has been "gifted" to a relative for $1. |
Conclusion: |
With the outlier, the mean changed.
With the outlier the median did not change. |
|
|
| If
All of the Data is Increased by (or Multiplied by) a Constant: |
| |
Data |
Mean |
Median |
Original Data Set: |
3, 5, 7, 9, 10, 11, 13, 18, 18, 20 |
11.4 |
10.5 |
Add 5 to each data value |
8, 10, 12, 14, 15, 16, 18, 23, 23, 25 |
16.4 |
15.5 |
Added: When the same value (5) was added to each value, the same amount (5) was added to the mean and median. Since all values shifted by the same amount, the central tendencies (mean and median) shifted by that same amount. |
Multiply 3 times each data value |
9, 15, 21, 27, 30, 33, 39, 54, 54, 60 |
34.2 |
31.5 |
Multiplied: When the same value (3) was multiplied times each value, the same amount (3) was multiplied times the central tendencies (mean and median). |
Find the mean, median and mode for the following data: {29, 24, 31, 40, 30, 35, 25, 28}
• First, put the data in ascending order: {24, 25, 28, 29, 30, 31, 35, 40}
(ascending order is needed to find the median)
• Mean: 
• Median: 24, 25, 28, 29, 30, 31, 35, 40
With the data in ascending order, you can easily find the median.
Average the two middle numbers: ½ (29 + 30) = 29 ½
|
NOTE: The re-posting of materials (in part or whole) from this site to the Internet
is copyright violation
and is not considered "fair use" for educators. Please read the "Terms of Use". |
|