|
We have worked with two-variable linear equations and their graphs, such as y = 2x + 8.
We can also look at these linear equations as linear functions.
The linear equations can be used to form linear functions.
 |
With the exception of vertical lines,
the graphs of linear equations form functions,
where each x-value corresponds to only one y-value.
Function notation replaces y with f (x).
y = mx + b or f (x) = mx + b |
|
A linear function is a function of the form f (x) = mx + b,
where m is the slope and b is the y-intercept.
The simplest linear function is f (x) = x, which is known as the
"parent function" for the family of linear functions.
Linear functions are graphed using the same methods used with linear equations:
Functions can appear in three basic formats: a table (or chart), an equation, or a graph.
Table
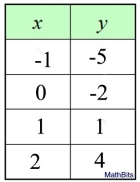
As the x increases by 1, the y increases by 3. The rate of change (slope) is constant.
m = 3/1 = 3
b = -2 since (0,-2)
|
Equation
f (x) = 3x - 2
f (x) = mx + b
m = 3
b = -2
|
Graph
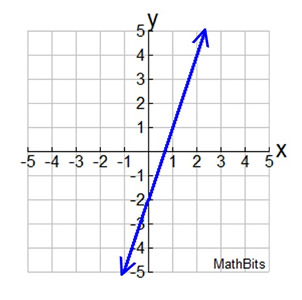 From (0,-2) to (1,1) gives slope = 3 From (0,-2) to (1,1) gives slope = 3
Slope = Δy /Δx = (change in y)/(change in x)
(1 - (-2)) / (1 - 0)
= 3/1 = 3
y-intercept: b = -2
|
| All three of these formats represent the same function. |
Slope is an important concept when dealing with linear functions.
Be sure you can identity the slope from any of the above mentioned formats.

Let's see what TABLES can tell us about functions.
You will notice, in all three tables, that the x-values change by the same equal amounts.
The graph will represent a linear function when the corresponding y-values also change by an equal amount. (The change amount for x does not have to equal the change amount for y.)
Linear:
(constant rate of change)
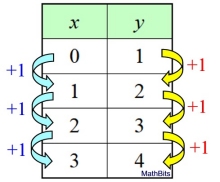
As x increases by 1, the y also increases by 1. Since the rate of change is constant, this table represents a linear function.
Δy /Δx = 1/1 = 1 = slope |
Non-linear:
(not constant rate of change)
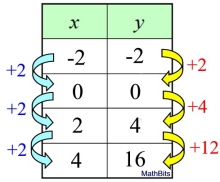
As x increases by 2, y increases by a larger value each time. Since the rate of change is not constant, this table represents a non-linear function. Not a straight line!
Not all functions are linear!
|
Linear:
(constatnt rate of change)
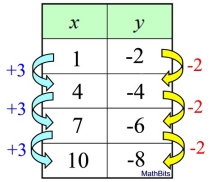
As x increases by 3, y increases by -2. Since the rate of change is constant, this table represents a linear function.
Δy /Δx = -2/3 = slope |
NOTATION: the notation Δy is read as "delta y" where the Greek symbol Δ represent "the change in".
Δy /Δx = (delta y) / (delta x) = (the change in y) / (the change in x) = slope
 In the two "linear tables", shown above, In the two "linear tables", shown above,
the value added to each y, divided by the value added to each x,
is
the constant slope (m) of the line.
("change in y" over "change in x" = slope)
| Graphical Changes when Slope Changes: |
Let's take a look at how slopes that are "greater than zero", "less than zero",
or "equal to zero" affect the graph of a linear function.
(Remember that vertical lines are NOT functions, so their equations will not be discussed on this page.)
 |
Some Observations with y = mx + b:
 positive slope: the line slants uphill, as read from left to right. positive slope: the line slants uphill, as read from left to right.
• As the positive slope, m, gets larger, the uphill slant of the each line gets steeper. As the slope gets extremely large (a very, very big number), those lines becomes nearly vertical.
If the line is vertical, the slope is undefined (because it has no horizontal change), and the line is not a function.
• As the positive slope, m, gets smaller (closer to zero), the downhill slants of those lines lose steepness and start to flatten.
|
zero slope: the line is horizontal (flat).
negative slope: the line slants downhill, as read from left to right.
• As the negative slope, m, decreases (remember -2 is > -3), the downhill slants of those lines get steeper.
• As the negative slope, m, increases (remember -4 is < -2), the downhill slants of those lines start to flatten out. |
When dealing with real numbers, the Additive Identity (adding a 0), expressed as a + 0 = a, returns the value upon which it is being applied. The Multiplicative Identity (multiplying by 1) does the same: a • 1 = a.
In keeping with this idea of "returning the value upon which you are working", let's examine the Identity Function.
Identity Function: f (x) = x.
The identity function is a function that always returns the argument (the value that was fed into the function).
f (x) = x for all values of x to which f can be applied.
|
| x |
-3 |
-2 |
-1 |
0 |
1 |
2 |
3 |
4 |
| f (x) |
-3 |
-2 |
-1 |
0 |
1 |
2 |
3 |
4 |
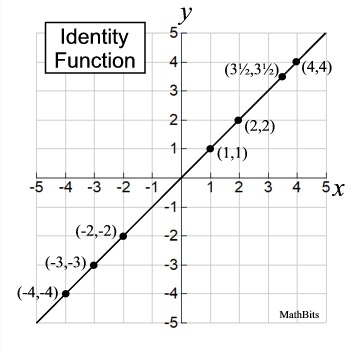
The table for an Identity Function shows the same values for both the domain (the x-value input) and the range (the y-value output).
domain: all Reals range: all Reals
The graph shows the Identity Function as a linear function rising from Quadrant III, increasing through the origin, up into Quadrant I.
The slope of the Identity Function is 1.
f (x) = mx + b = 1•x + 0 = x |
 |
The constant function returns the same y-output regardless of what was given as x-input.
The y-value from a constant function is the same for every input value.
Constant Function: f (x) = c where c is any constant.
The constant function returns the same y-output for all x-input values.
|
| x |
-3 |
-2 |
-1 |
0 |
1 |
2 |
3 |
4 |
| f (x) |
2 |
2 |
2 |
2 |
2 |
2 |
2 |
2 |
| g(x) |
-3 |
-3 |
-3 |
-3 |
-3 |
-3 |
-3 |
-3 |
The graph at the right shows TWO constant functions, f (x) = 2 and g(x) = -3.
Constant functions will always be horizontal lines. Remember that a vertical line is not a function (it does not pass the Vertical Line Test for functions).
While the domain (the x-value input) of a constant function may vary, the range (the y-value output) will always remain the same.
f (x): domain: all Reals range: {2}
g(x): domain: all Reals range: {-3}
The graph shows the Constant Function as a horizontal linear function. |
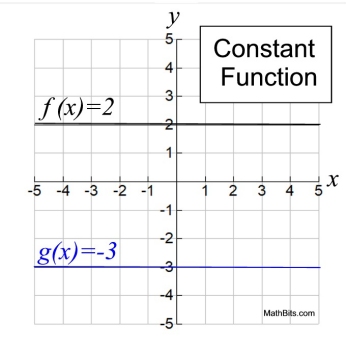 The slope of the Constant Function is zero. The slope of the Constant Function is zero.
The line has a lot or "run", but no "rise".
So slope = rise/run = 0/2 or 0/-3 = 0.
Equations: f (x) = mx + b = 0•x + 2 = 2
g(x) = mx + b = 0•x + (-3) = -3 |

NOTE: The re-posting of materials (in part or whole) from this site to the Internet
is copyright violation
and is not considered "fair use" for educators. Please read the "Terms of Use". |
|