|
| "Linear" refers to "line" and "line" refers to "straight line". |
One-variable linear equations: x = 3, y = 2
• These equations have only one variable (such as x).
• The equation can be expressed in the form ax + b = 0 where a and b are real numbers.
• For Algebra 1, there will be only ONE solution to such an equation.
• The graphs of these equations will be only a vertical (or possibly horizontal) straight line.
Two-variable linear equations: y = mx + b
• These equations have two variables (such as x and y).
•
The equation can be expressed in the form ax + by + c = 0 (where a, b and c are real numbers, and the coefficients of x and y are not zero).
•
A solution to this equation is an ordered pair, (x, y).
There are INFINITELY many solutions to such an equation.
•
These equations play an important role in graphing in a coordinate plane, where x represents the horizontal axis, and y represents the vertical axis.
These equations are most often written in a " y = " form.
Let's quickly remember the forms of linear equations we will be graphing:
| Slope Intercept Form |
Point Slope Form |
Standard Form |
Horizontal Lines |
Vertical Lines |

this form of "y=" quickly gives the slope, m, and y-intercept, b, where the
line crosses the y-axis. |
when graphing, put this equation into "y = " form to easily read graphing information. |
Ax + By = C
when graphing, put this equation into "y = " form OR use the "intercept method" shown below. |
y = 3
(or any number)
The slope is zero.
All y-values equal the same number. |
x = -2
(or any number)
Slope does not exist.
All x-values =
the same number. |
Note: All graphs can be prepared using a chart (or table).

 Now, let's refresh our memories on how to graph two-variable linear equations. Now, let's refresh our memories on how to graph two-variable linear equations.
 Graphing with a table or chart (T-chart): Graphing with a table or chart (T-chart): |
The basic method of graphing a straight line is to prepare a table (or T-chart) of x-values and y-values to obtain points, and to plot these points. When dealing with straight lines, with constant (never changing) slopes, only a few points are needed to produce the line.
|
Choosing Chart Values: Charts typically include, both positve x-values and negative x-values. While choosing only two points will determine a straight line, it is safer to choose at least 3 points. The third point will indicate if an error was made during the calculations of the other two points. |
|
Graph y = 2x + 3
We are going to choose 5 x-values for our chart.
x |
y = 2x + 3 |
y |
-3 |
|
-3 |
-1 |
2(-1) + 3 |
1 |
0 |
2(0) + 3 |
3 |
1 |
2(1) + 3 |
5 |
3 |
2(3) + 3 |
9 |
Plot (x,y) on the coordinate grid. |
|

 |
Remember to include the "completed" graph items:
• labeling the x and y axes
• labeling the scales on the axes (at least to 1 unit on both axes)
•
placing the statement of the equation on the graph.
• using a ruler, straight edge or a folded piece of paper to draw a line. |
Tidbit of information. The x-coordinate may be called the abscissa.
The y-coordinate may be called the ordinate. |
| Graphing using the Slope-Intercept Form: |
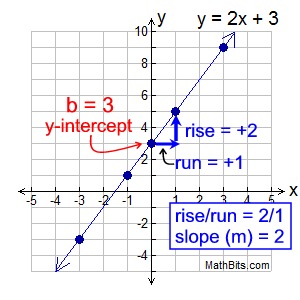
Linear equations often appear in the form y = mx + b. In this form, m is the slope of the line and b is the y-intercept (where the line crosses the y-axis.), thus its name "Slope - Intercept Form".
Let's take another look at the example above, y = 2x + 3. |
We can see that y = 2x + 3 is in the Slope - Intercept Form, with m = 2 and b = 3.
y = mx + b
y = 2x + 3
We could have graphed this line without completing a table or chart, by simply using where the line crosses the y-axis and its slope.
Start by plotting the y-intercept (b):
b = 3 or (0,3).
|
|
Then, from that point, apply the slope ( m): m = 2 or  . Then move
"over 1 up 2" (or "up 2 over 1")
and plot the point (1,5). Draw the line.
|
|
Choose a test point: When using this method, to guarantee you did not make a mistake, choose an easy value for x (such as x = 3) and substitute to find the y-value.
Plot these x = 3 and y = 9 values as a test point (3,9).
If the test point lies on your line, you can be pretty sure your work is correct. |
|
Let's look at another example where the form y = mx + b is "hiding". |
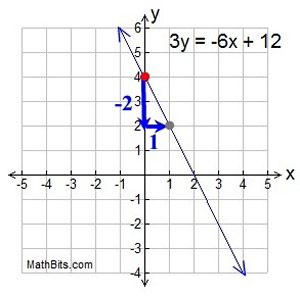
Graph 3y = -6x + 12
At first glance, it appears that this line is not a candidate for the Slope - Intercept Form. But, if we use our algebra skills, we can re-write this equation so that it fits the Slope - Intercept Form of y = mx + b.
We need the equation to be "y = ", not "3y =".
If we divide ALL terms by 3, we will get the equation we need.
y = -2x + 4
We now have the form y = mx + b.
|
|
The y-intercept (b) is +4. Plot this point first, (0,4).
The slope (m) is -2. So the rise/run = -2/1.
Starting at the y-intercept, go down 2 units and right 1 unit. This new location (1,2) is another point on the line. Draw the line.
Test point: Choose x = 2, giving y = 0. The point (2,0) is on the graph.
|
| Graphing using Intercept Method: |
Now, let's take a look at another graphing method. This method may be less commonly used,
but it can often save time in the graphing process.
Graph 2x + 3y = 12
You can certainly re-write this equation and use a "table" or the "slope-intercept method" for graphing. But, there is also another option which may be easier to use in this situation.
We are going to obtain the x-intercept and the
y-intercept. We will then choose one additional test point (to avoid possible errors) and show that all three points form a line.
Remember:
to find the y-intercept, set x = 0.
to find the x-intercept, set y = 0. |
|
|
If you want to organize your work,
you can set up a small table or chart.
|
The first slot is for the
y - intercept (where x = 0).
The second slot is for the
x - intercept (where y = 0).
The third slot is for any test point you choose to plot to check for errors. (Hint: choose an x-value that will fit easily into the equation.) |
This graphing approach is particularly useful when your equation is in standard form,
Ax + By = C. |
|
Here is the completed chart
for the graph seen above.
|
y-intercept - set x = 0
2•0 + 3y = 12
3y = 12 and y = 4
x-intercept - set y = 0
2x + 3•0 = 12
2x = 12 and x = 6 |
We chose x = 3 to create the test point.
2•3 + 3y = 12
6 + 3y = 12
3y = 6
y = 2 |
The fact that these three points form a straight line on the graph tells us that we did not make an error. |
|
|
|
This method is just another way to look at graphing a linear equation.
It does not replace your need to understand (and be able to use)
the "table-method" or the "slope-intercept" method. |
|
| Using the graphing calculator: |
You need to be able to graph linear equations without the use of a graphing calculator
(or other graphing device).
Use your graphing calculator to "check" your work.
The graphing calculator can be an important investigatieve tool if you want to experiment and
see what happens when you change the slope of a line, or you multiply the equation
of a line by a constant, or you make other changes to a line.

NOTE: The re-posting of materials (in part or whole) from this site to the Internet
is copyright violation
and is not considered "fair use" for educators. Please read the "Terms of Use". |
|