|
For more information on Exponential Functions, see Exponentials.
An exponential function with base b is defined by f (x) = abx
where a ≠0, b > 0 , b ≠1, and x is any real number.
The base, b, is constant and the exponent, x, is a variable.
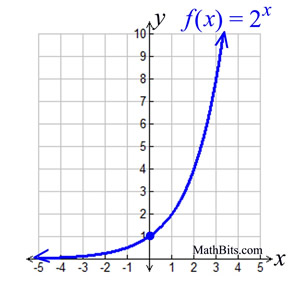
In the following example, a = 1 and b = 2.
 |
x |
y = f (x) |
-2 |
2-2 = ¼ |
-1 |
2-1 = ½ |
0 |
20 = 1 |
1 |
21= 2 |
2 |
22 = 4 |
3 |
23 = 8 |
|
Shape: Most exponential graphs will have this same arcing shape.
Rate of Change:
This graph does not have a constant rate of change, but it has constant ratios. It is growing by common factors over equal intervals. |
Features (for this graph):
• the domain is all Real numbers.
• the range is all positive real numbers (not zero).
• graph has a y-intercept at (0,1). Remember any number to
the zero power is 1.
• when b > 1, the graph increases. The greater the base, b,
the faster the graph rises from left to right.
• when 0 < b < 1, the graph decreases.
• has an asymptote (a line that the graph gets very, very close
to, but never crosses or touches). For this graph the
asymptote is the x-axis (y = 0).
|
|
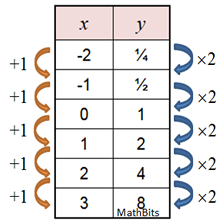 As x increases by +1, As x increases by +1,
y increases by x 2.
|
|
|
|
|
More Examples of Exponential Functions:
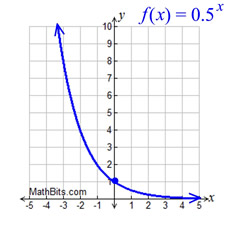 Graph with 0 < b < 1.
Each time x in increased by 1, y decreases to ½ its previous value. |
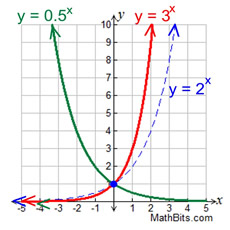 Compare graphs with varying b values.
Notice that all three graphs pass
through the y-intercept (0,1). |
In word problems, you may see exponential functions drawn predominantly in the first quadrant. |
Exponential Function - Transformation Examples:
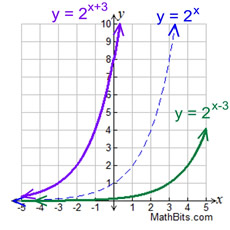 Horizontal Translations.
Notice the points (0,1), (3,1), (-3,1). |
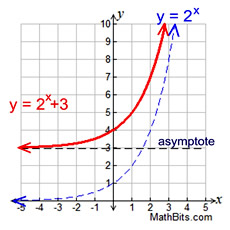 Vertical Shift up 3 units.
Notice y-intercept at (0,4) and
asymptote at y = 3. |
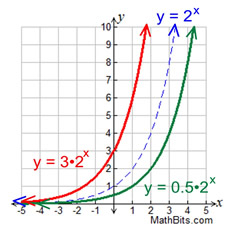
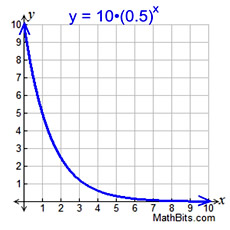
Vertical Stretch/Shrink. Notice
y-intercepts at (0,1), (0,3), (0,½).
which relate to formula's " a" value. |

NOTE: The re-posting of materials (in part or whole) from this site to the Internet
is copyright violation
and is not considered "fair use" for educators. Please read the "Terms of Use". |
|
|