|
Directions: Read carefully. Choose the best answer.
1. |
Find the slope of the line passing through the points (-4,3) and (-5,2).
|
|
|
2. |
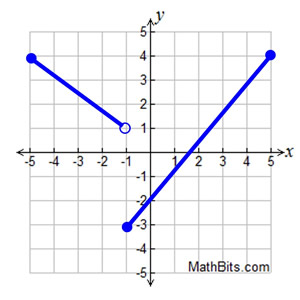
Regarding the graph at the right, what is the average rate of change over the interval
-1 < x < 5 ?
Choose:
|
|
|
3. |
Find the average rate of change on the graph
of y = x2 + 4x + 1 on the interval -1 < x < 4.
Choose:
|
|
|
4. |
Nelson took a summer job, for five weeks, where he received a weekly salary plus tips. His take-home pay is recorded in the table at the right. What was the average rate of change in his weekly take-home pay over the five weeks of his job?
Choose:
|
Week |
Weekly Salary |
1 |
$60 |
2 |
$65 |
3 |
$72 |
4 |
$75 |
5 |
$80 |
|
|
5. |
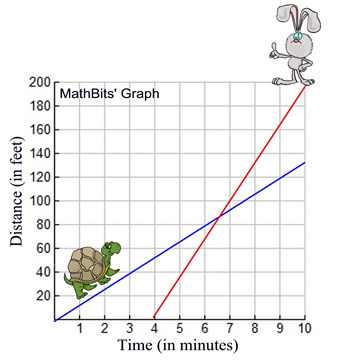
The graph at the right shows the race between Tristin, the tortoise, and Harlow, the hare.
a) How much of a head start did Harlow give Tristin?
Choose:
b) How far into the race had the boys traveled before they were at the same location at the same time (to the nearest foot)?
|
|
| |
Choose:
|
| |
c) Express Tristin's constant speed (average rate of change).
Choose:
|
| |
d) Express Harlow's constant speed (average rate of change).
Choose:
|
|
6. |
For f (x) = x3 - 1, find the average rate of change from x = 0 to x = 2.
Choose:
|
 |
|
7. |
Pertaining to the table at the right:
a) Find the average rate of change on the interval 2 < x < 3.
Choose:
b) Find the average rate of change on the interval 4 < x < 5.
Choose:
|
x |
f (x) |
1 |
21 |
2 |
18 |
3 |
16 |
4 |
10 |
5 |
8 |
|
|
| |
c) Find the average rate of change on the interval 3 < x < 4.
Choose:
|
| |
d) Is the function displayed in the table a linear function?
Choose:
|
|
8. |
Amazon sales for a new video game during its first week of release (7 days) can be modeled by the function S(x) = 2x, where S(x) represents the number of sales (in hundreds) at the end of each day. Find the average rate of change in the sales from day 2 to day 6.
Choose:
|
 |
|

NOTE: The re-posting of materials (in part or whole) from this site to the Internet
is copyright violation
and is not considered "fair use" for educators. Please read the "Terms of Use". |
|