|
Many real world pheonomena can be modeled by functions that describe how things grow or decay as time passes. Examples of such phenomena include populations, bacteria, radioactive substances, temperatures, bank accounts, credit payments, compound interest, electricity, medicine, sport tournaments, etc.
Any quantity that grows (or decays) by a fixed percent at regular time intervals is said to possess exponential growth or exponential decay.
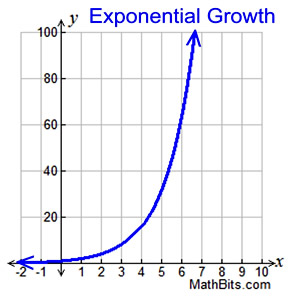 In exponential growth, the quantity increases,
slowly at first, and then very rapidly. The rate of change increases over time. The rate of growth becomes faster as time passes. This rapid growth is what is meant by the expression "increases exponentially". |
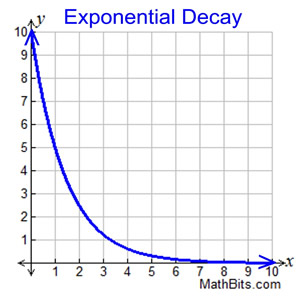 In exponential decay, the quantity decreases very rapidly at first, and then more slowly. The rate of change decreases over time. The rate of decay becomes slower as time passes.
 |
At the Algebra 1 level, there are two functions that can be easily used to illustrate the concepts of growth and decay in applied situations. If a quantity grows by a fixed percent at regular time intervals, the pattern can be depicted by these functions.
Exponential Growth:
y = a(1 + r)x |
|
Exponential Decay:
y = a(1 - r)x |
|
Remember that our original exponential formula was y = a(b)x.
You will notice that in these new growth and decay functions,
the b value (called the growth factor) has been replaced either by (1 + r) or by (1 - r).
The growth "rate" (r) is determined from b = 1 + r, giving r = b - 1.
The decay "rate" (r) is determined from b = 1 - r, giving r = 1 - b.
"r" is the fixed percent rate of growth or decay per time interval.
a = initial value (the amount before measuring growth or decay)
r = growth or decay rate (percentage expressed as a decimal)
x = number of time intervals that have passed |
These two functions are extensions of the strategies we developed in the last lesson on
Percents of Increase and Decrease. The "extension" (the new addition) is that the calculations now involve an exponent of time, x.
The letters used to represent the time (x) and the ending amount (y) can change based upon the terms used in a word problem.
The use of x and y used here is a reminder of which variable corresponds to which axis.

Example 1: Exponential Growth
A common example of exponential growth deals with the growth of bacteria. Bacteria have the ability to multiply at an alarming rate, where each bacteria splits into two new cells, doubling the number of bacteria present. Let's start with one bacteria which can double every hour. How many bacteria will be present after 8 hours?
If an amount "doubles", the rate of increase is 100%.
| End of the hour: |
1 |
2 |
3 |
4 |
5 |
6 |
7 |
8 |
| Bacteria present: |
2 |
4 |
8 |
16 |
32 |
64 |
128 |
256 |
| Visible Pattern: |
21 |
22 |
23 |
24 |
25 |
26 |
27 |
28 |
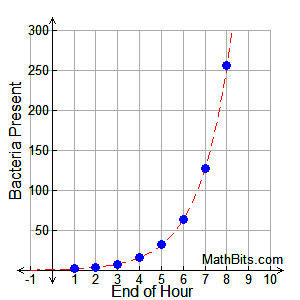 |
The pattern tells us that this situation can be
represented by y = 2x.
Using the growth formula we have y = a(1 + r)x
where a = 1 (we start with 1 bacteria),
and r = 100%, since the amount doubles.
y = 1(1 + 1.00)x = 2x. (same result)
Notice that the graph is a scatter plot.
You cannot have a fractional part of a bacteria.
The dotted line is the exponential function which contains the scatter plots (the model). |
Note: In reality, exponential growth cannot continue indefinitely. Eventually, there would come a time when there would no longer be space or nutrients to sustain the bacteria. Exponential growth realistically refers to only the early stages of a process and to the speed of the growth.
Example 2: Exponential Decay
The NCAA Basketball Championship (also known as March Madness) is an example of exponential decay. At each round of the tournament, teams play against one another with only the winning teams progressing to the next round. In other words, the number of teams playing at each round is half of the number of teams playing in the previous round. Let's start with 64 teams going into round 1. How many teams are left to begin play in round 5?
If an amount is "cut in half", the rate of decrease is 50%.
| Round: |
1 |
2 |
3 |
4 |
5 |
| Number of teams left playing at end of round: |
32 |
16 |
8 |
4 |
2 |
| Visible Pattern: |
64/21 |
64/22 |
64/23 |
64/24 |
64/25 |
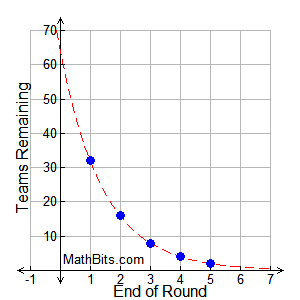
A scatter plot is needed as a fractional
part of a team is not considered. |
The pattern tells us that this situation can be represented by  . .
Using the decay formula we have y = a(1 - r)x where a = 64 (starting with 64 teams),
and r = 50%, since the number of teams are cut in half each round.
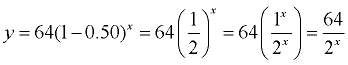
(same result)
At the end of the fourth round, the tournament will be entering the "Final Four" stage,
with only four teams remaining to play. |
Exponential growth and decay are mathematical changes.
The rate of the change continues to either increase or decrease as time passes.
In exponential growth, the rate of change increases over time
- the rate of the growth becomes faster as time passes.
In exponential decay, the rate of change decreases over time
- the rate of the decay becomes slower as time passes.

NOTE: The re-posting of materials (in part or whole) from this site to the Internet
is copyright violation
and is not considered "fair use" for educators. Please read the "Terms of Use". |
|