We have seen that a line graph can be used to represent a wide range of real world data.
But, dealing with real world data, can introduce some situations that don't quite "fit" into being represented by the entire plotting of a straight line.
Consider the following examples:
1. A biker is traveling at a constant speed of 2 mph.
The distance traveled can be represented by the equation y = 2x. |
Representing the Entire Line |
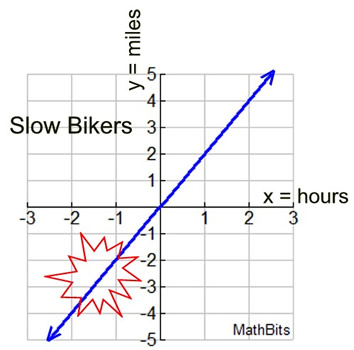 Negative hours? Negative miles?
|
Representing Partial Line |
Since time (hours) and distance (miles) are not concepts that are thought of as negative, the graph of a problem such as this is limited to a first quadrant portion of the line.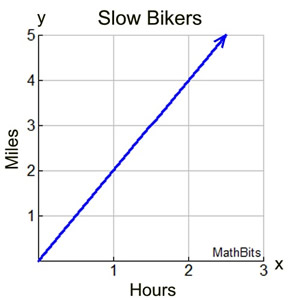 |
NOTE: It could be argued that even the first quadrant graph is also misleading.
The arrow on the line indicates that it goes on to infinity, and the biker riding for hours into infinity is unrealistic.
2. A store is selling a hardcover book on magicians for $5. The sale of the book can be represented by a linear graph. (y = 5x where y = dollars, x = books sold) |
Represented by Partial Line |
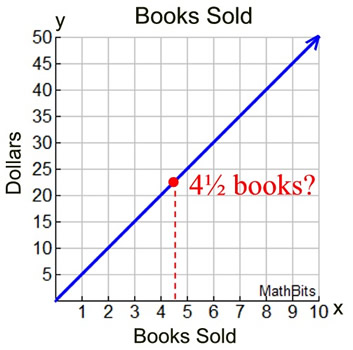
How do you sell ½ of a book?
In the biker example above, considering ½ of an hour makes sense, but selling ½ of a book does not make sense.
|
Represented by Points Only |
It is more realistic to only plot points for this graph. This graph shows plotting only positive integers values for x.
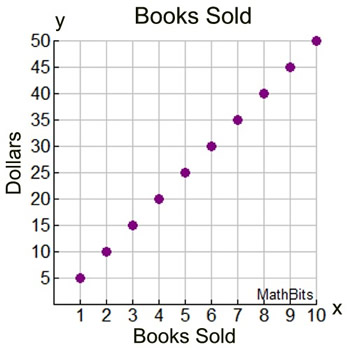 Yes, these points "lie" on the line y = 5x, but not all points on that line can be used in this problem.
 |
In an effort to present graphs that represent "actual" data in real world situations,
we have to be careful as to how we prepare graphs.
There are situations where "limitations" on graphs are needed to present realistic data.
These limitations are referred to as "constraints".
|
Constraints are restrictions (limitations, boundaries) that need to be placed upon variables used in equations that model real-world situations. |
It is possible that certain solutions which make an equation true mathematically, may not make any sense in the context of a real-world word problem. Constraints then become necessary to allow the mathematical model to realistically represent the situation.
It is possible to set constraints
on the x-values
(the independent variable)
or the y-values (dependent variable) associated with an equation.
When graphing, the set of all possible x-coordinates used to create the graph are referred to as the domain. Constraints may already be stated in a problem as limitations upon the domain, or may need to be specified if the situation is reality based.
The set of all of the y-coordinates used by the
domain elements is called the range. |
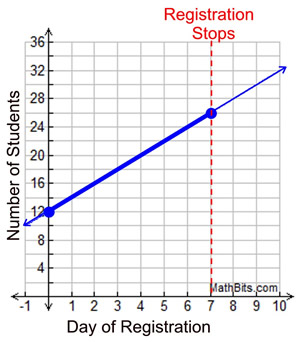
| 3. A graph is being prepared to represent the registration of students for a new class on computer programming. |
It is discovered that the registration for a new computer programming class can be modeled by the equation y = 2x + 12, where y = the number of students registered at the end of each day, and x = the day of registration. The class has 12 students pre-registered before the registration process begins, and the registration closes after 7 days.
While it can be said that y = 2x + 12 models the registration process for this computer class, you can see that the "real" model is only a portion of this straight line. There are no "negative" days for the registration process, and there are no days beyond Day 7 for registration.
A better model is an equation with constraints:
 |
The correct graph to represent this registration is a line segment (and not a full straight line).
|