Functions can be represented in a variety of forms,
such as "descriptions", "tables", "equations" and/or "graphs".
Function Description:
A function may be represented with a description of its process.
"The function will be such that each value entered
will be
multiplied times two
and added to the number one."
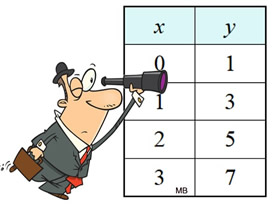
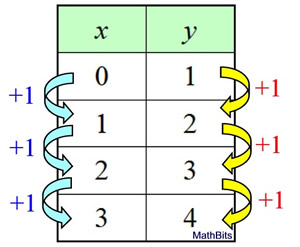
Function Table:
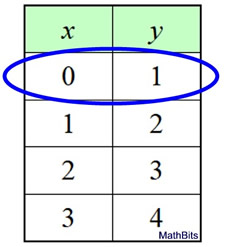
A function may be represented with a table of the ordered pairs.
A function is shown in the table at the right.
By examining the table, you can see that each y-value
is twice the corresponding x-value plus 1.
Function Equation:
A function may be represented
with an equation of the form "y =".
The equation y = 2x + 1 represents our function.
The equation may first appear in a different form
such as 2x - y = -1 or 2x - y + 1 = 0.
These are all the same equation.
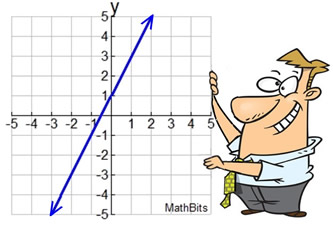
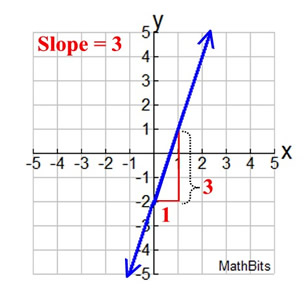
Function Graph:
A function may be represented
with a graph.
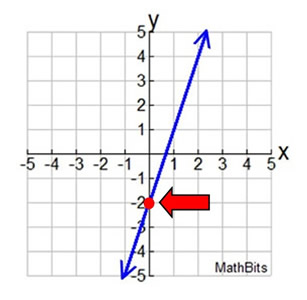
The graph shows a function whose y-value is twice the x-value plus 1, or y = 2x + 1.
This graph assumes that all Real numbers can be "fed" into this function.
(All Real numbers are the domain.)
Comparing functions expressed in different forms is a popular question.
Given the two linear functions shown below:
Function 1:
x
y
0
1
1
2
2
3
3
4
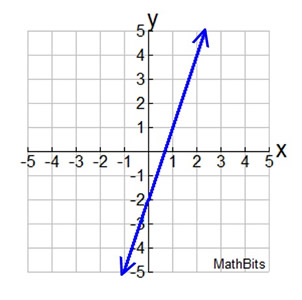
Function 2:
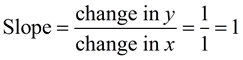
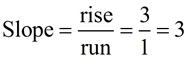
a) Which function has the larger slope? Function 2
b) Which function has the larger y-intercept? Function 1
y-intercept has an x-value of 0. y-intercept is 1.
y-intercept is where the graph crosses the y-axis. y-intercept is -2.
NOTE: There-posting of materials(in part or whole) from this site to the Internet
is copyright violation
and is not considered "fair use" for educators. Please read the "Terms of Use".