|
|
A rational function is a fraction where both the numerator and denominator are polynomials. |
|
Rational functions deal with:
• restrictions that the denominators never be zero.
• zeros, where the numerator is zero, but the denominator is not zero.
• intercepts, based upon analysis of factors and behavior.
• vertical asymptotes, based upon zero denominators.
• horizontal asymptotes based on the polynomials' degrees.
• holes, based upon common factors.
(You will also see "slant" asymptotes
in future courses.)
The graphs of rational functions are more complicated than the functional graphs we usually study. These graphs have a LOT of interesting facts going on that will need investigation.
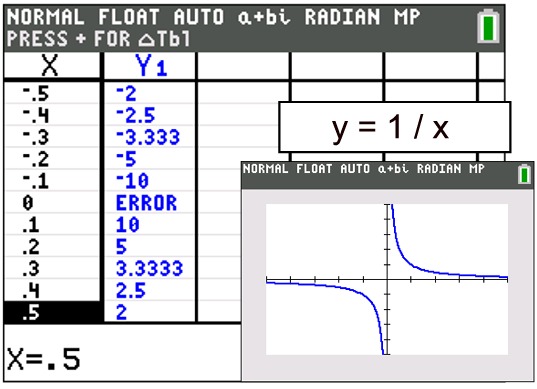
Let's start by examining the graph of a simple rational function. You may have seen this graph in the past. Due to the restrictions that are placed on the x-values of rational functions, you can guess that their graphs are going to be more complicated to predict around these undefined locations.
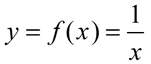 ; x ≠ 0 ; x ≠ 0
Notice, in the table, the numerical behavior of the graph around its undefined value at the point x = 0.
The function changes its sign. Its y-values are negative to the left of 0, but they are positive to the right of 0. |
|
|
|
Also, notice what is happening to the shape of the graph surrounding x = 0.
• As the graph approaches x = 0 from the right, its y-values are getting increasingly larger.
As
x → 0+, y → + ∞.
( 0+ approaches from right, 0- approaches from left)
• As the graph approaches x = 0 from the left, its y-values are getting increasingly smaller.
As x → 0-, y → - ∞.
• x = 0 is a vertical asymptote for this graph. |
|
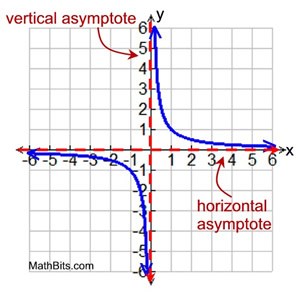
A vertical asymptote is a vertical straight line toward which a function approaches closer and closer, but never reaches (or touches). |
 Vertical asymptotes correspond to the undefined locations of rational functions. Vertical asymptotes correspond to the undefined locations of rational functions. |
Also, notice how the graph is "approaching" the x-axes at the far right and far left.
• As x gets increasingly larger, (x → ∞), the y-values are positive and are getting closer and closer to 0 (the x-axis), but they will never actually get to zero. They will just continue to get closer and closer to zero (the x-axis).
• As x gets increasingly smaller, (x → - ∞), the y-values are negative and are also getting closer and closer to 0 (the x-axis), but they will never actually get to zero. They will also just continue to get closer and closer to zero.

• y = 0 is a horizontal asymptote for this graph.
|
A horizontal asymptote is a horizontal straight line toward which a function approaches closer and closer. The end behavior of the graph is described as the x-values get extremely large and extremely small. |
Horizontal asymptotes are determined by comparing the degrees of the numerator and denominator polynomials (when expressed in "single fraction" form).
 = leading terms = leading terms |
• if n < m, the x-axis is the horizontal asymptote
• if n = m, the line y = a/b is the horizontal asymptote
• if n > m, there is no horizontal asymptote |
|
The behavior of the graph in relation to a vertical asymptote is clear cut and constant: the graph NEVER touches them. Never!
The behavior of the graph in relation to a horizontal asymptote, however, is not as clearly defined. You may only approach a horizontal asymptote, or you may touch a horizontal asymptote, or you may even cross a horizontal asymptote. Horizontal asymptotes give more of a general impression of what the graph is doing, and are generally associated with the far ends of the graph (end-behavior). |
• There is one additional feature you may encounter that is not seen is our simple graph above.
It is a rational graph that has a "hole".
|
A hole in a rational function is one missing point on the graph. It occurs from a "common factor" where the x-value makes both the numerator and denominator zero. (This is called a "removable discontinuity") |
To find the hole, find any common factors that cancel out. The x-value making these factors zero is the x-coordinate of the hole. The y-coordinate will be the value obtained by substituting this x-value into the simplified function. |
Let's take a look at a function possessing all of these features:
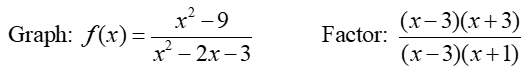
The initial graph shows the shape of the function
f(x) = (x2 + 3) / (x2 - 2x - 3) = (x + 3) / (x + 1)
.
(The vertical and horizontal asymptotes were added separately to the graph by additional calculator entries.)
|
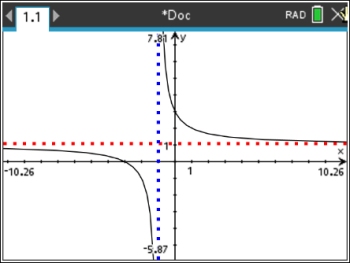
What we did not see in the graph was that there is a hole at x = 3.
There is a common factor of (x - 3) so there is a hole at x = 3.
Plug 3 into f (x) = (x + 3) / (x + 1) to find y = 3/2. Hole: (3, 1½)
|
The simplified function has a zero at (-3,0), since the numerator is zero at x = -3. but the denominator is not.zero.
The vertical asymptote is x = -1, since the function has a zero denominator at x = -1 (undefined).
The horizontal asymptote is x = 1, since degrees of the numerator and denominator are equal, with a coefficient ratio of 1.
Since there is a common factor of (x - 3) in this rational, there is a hole at x = 3.
|
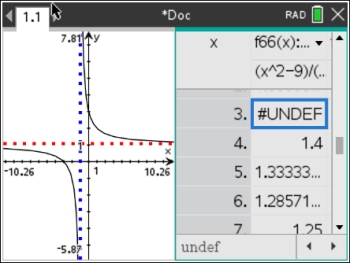
A final look at the amended graph (with the hole indicated)
shows the
vertical asymptote, the horizontal asymptote,
and the hole
.
This graph shows us:
• the locations where the function is undefined,
• what is occurring at these undefined locations,
• the x-intercept, and
• the end behaviors of the graph. |
|
Don't Panic!!!
In Algebra 2, you only need to have a general understanding of this type of graph so you will know what you are seeing on your graphing calculator, and how the graph relates to the restrictions on a rational function.
|
FYI only:
How to sketch a rational function without a graphing calculator:
(and yes, this will be a "rough", but sufficient, sketch)
| 1. As with all functions, find the intercepts: |
| |
• for the x-intercept set y = 0
• for the
y-intercept set x = 0 |
Beware: As we saw in the first graph above,
rational functions may not have any intercepts. |
| 2. Find the vertical asymptote(s): |
| |
• set the denominator = 0 and solve |
3. Find the horizontal asymptote(s): (assuming the rational function is expressed as a single fraction)
|
| |
• get the degree of the numerator, n, such as axn
• get the degree of the denominator, m, such as bxm
• if n < m, the x-axis is the horizontal asymptote
• if n = m, the line y = a/b is the horizontal asymptote
• if n > m, there is no horizontal asymptote
|
| 4. Check for any possible holes: |
| |
• set any common factors = zero to locate holes |
| 4. Use the vertical asymptote(s) to divide the x-axis into regions. |
| |
• Graph at least one point in each region.
• Use this point to determine the position of the graph in relation to the horizontal asymptote(s).
• It may be necessary to graph additional points to get the shape of the graph.
|
| 5. Sketch the graph. |
|
How to use your graphing calculator for
rational graphs
Click here. |
|
|

NOTE: The re-posting of materials (in part or whole) from this site to the Internet
is copyright violation
and is not considered "fair use" for educators. Please read the "Terms of Use". |
|