|
When you first learned to graph straight lines, you did so by preparing a table (or chart) of x-values
and y-values to obtain points on the graph, and you plotted these points. Since you were dealing with straight lines, with constant (never changing) slopes, only a few points (actually only two) were needed to produce the line.
A similar approach can be used for graphing quadratic functions. These graphs, however, can seldom be drawn properly by plotting only two or three points because the slope of a parabola is not constant. More points are needed to uncover the shape of the graph (a parabola) and its location on the set of coordinate axes.
 Let's take a look at chart graphing for a quadratic function.
| Graph y = x2 - 4:
A chart is prepared using both positive and negative values for x.
Since we were not given any information as to what values of x to use in the chart, we are "guessing" at which values will tell us the entire story about this graph.
x |
x2 - 4 |
y |
-3 |
|
5 |
-2 |
(-2)2 - 4 |
0 |
-1 |
(-1)2 - 4 |
-3 |
0 |
(0)2 - 4 |
-4 |
1 |
(1)2 - 4 |
-3 |
2 |
(2)2 - 4 |
0 |
3 |
(3)2 - 4 |
5 |
It is crucial when plotting a parabola
to locate the vertex (the turning point)
.to get a true representation of the graph. |
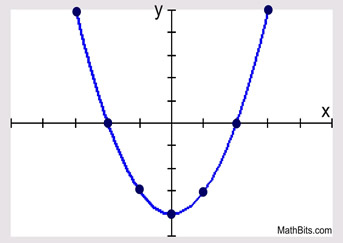
The points are plotted to reveal the graph. Be sure to draw a "smooth" curved graph. Do not play "connect the dots" by drawing straight line segments between the points. There are no straight line segments in a parabola, as its slope is never constant. Note that this parabola is symmetrix with respect to the y-axis, making (0,-4) the vertex.
|
We were lucky in choosing the set {-3, -2, -1, 0, 1, 2, 3} for the x-values in our chart,
since the turning point, along with the roots, were included in our choices.
The chart, along with the statement of the equaiton, reveal pertinent information about the graph:
opening upward, vertex (turning point) at (0,-4), axis of symmentry at x = 0,
and zeros (roots) at (-2,0) and (2,0).
Remember: The zeros are the points where the graph crosses the x-axis (the x-intercepts).
|
Choosing Chart Values: You need to guarantee that the x-values you choose for your chart will show pertinent information about the graph. Start by finding the axis of symmetry of the parabola from its equation. The axis of symmetry is a vertical line through the vertex, with equation  . Use this x-value as the "middle" x-value in the chart and choose 3 (or more) points greater than (above)
and less than (below) this x-value. |
|

|
For
calculator help
with
graphing
parabolas
click here. |
|
|
|
For calculator help with graphing parabolas
click here. |
|
|

NOTE: The re-posting of materials (in part or whole) from this site to the Internet
is copyright violation
and is not considered "fair use" for educators. Please read the "Terms of Use". |
|