|
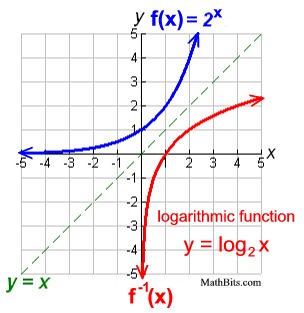
Let's start by taking a look at the inverse of the exponential function, f (x) = 2x .
In the lesson "Intro to Inverses of Functions", we saw that the inverse of a function is found when the
inputs (x) and outputs (y) exchanged places. The graph of the inverse is a reflection of the original function over the identity line y = x.
f (x) = 2x
x |
-2 |
-1 |
0 |
1 |
2 |
3 |
f(x) |
¼ |
½ |
1 |
2 |
4 |
8 |
The inverse: f -1 (x)
x |
¼ |
½ |
1 |
2 |
4 |
8 |
f-1(x) |
-2 |
-1 |
0 |
1 |
2 |
3 |
This new inverse function is called a
logarithmic function
and is expressed by the equation:
y = log2 (x) |
 For f (x): Domain (-∞,∞), Range (0,∞)
For g (x): Domain (0,∞), Range (-∞,∞)
|
 Logs are Exponents!
 |
The logarithmic function is the function
 where b is any number such that b > 0, b≠ 1, and x > 0.
The function is read "log base b of x".
The logarithm y is the exponent to which b must be raised to get x.
|
 The inverse of the exponential function y = bx,
will be x = by (where the x and y change places).
Note that in the inverse, the y (the logarithm) becomes an exponent. |
|
Let's look more closely at the graph:
y = log2 x
The value of b (the 2) is referred to as the base of the logarithm.
Notice that x must be positive.
The parent function is
f (x) = logb x
|
|
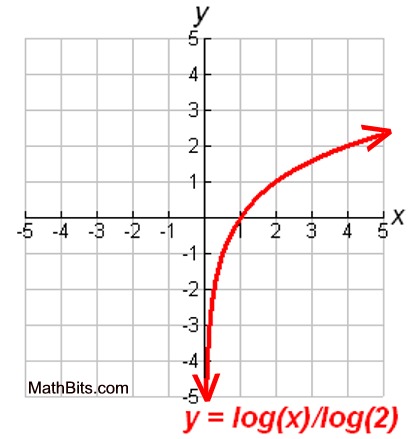 |
Most logarithmic graphs resemble this same basic shape. Notice that this graph is very, very close to the y-axis but it does not intersect with, nor cross, the y-axis. The x-values of this graph are always positive, and the y-values increase as the graph progresses to the right (as seen in the above graph). This graph has a vertical asymptote at x = 0 (the y-axis).
| logb 1 = 0 because b0 = 1 |
logb b = 1 because b1 = b |
Note: In a logarithmic graph, the "rate of change" increases (or decreases) across the graph.

Properties of Logarithmic Functions: f (x) = logb x |
The function f (x) = logb x features:
• a domain of positive real numbers, never zero, (0,∞).
• a range of all real numbers, (-∞,∞).
• an x-intercept at (1,0).
• a vertical asymptote at x = 0 (the y-axis).
• an increasing graph when b > 1.
• a decreasing graph when 0 < b < 1.
• a graph that passes the vertical line test for functions.
• a graph that passes the horizontal line test for functional inverse.
• a graph that displays a one-to-one function.
|
Parameter:
b - the base, controls the rate of change of the function |
y = log(x) implies y = log10(x)
called the common log (base 10).
|
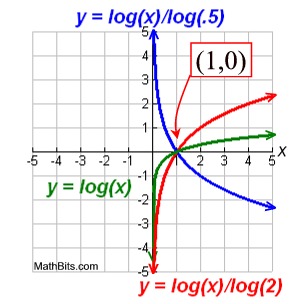
A few pointers about "intercepts" in logarithmic functions: |
|
|
y = logb x
|
y = a logb x
|
By examining the nature of the logarithmic graph, we have seen that the parent function will stay to the right of the x-axis, unless acted upon by a transformation.
The parent function, , will always have an x-intercept of one, occurring at the ordered pair of (1,0). .
There is no y-intercept with the parent function since it is asymptotic to the y-axis (approaches the y-axis but does not touch or cross it).
|
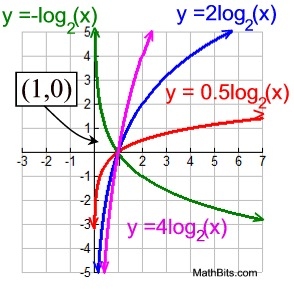
The transformed parent function of the form
y = a logb x, will also always have an
x-intercept of 1, occurring at the ordered pair of (1, 0).
Note that the value of a may be positive or negative.
Like the parent function, this transformation will be asymptotic to the y-axis, and will have no y-intercept. |
B U T . . . Transformations can change the game!
If a
transformed logarithmic function includes, for example, a vertical or horizontal shift, all bets are off. The horizontal shift can affect the x-intercept and the possibility of a y-intercept, while the vertical shift can affect the x-intercept.
In these situations, you will need to examine the graph carefully to determine what is happening. |
 |
|
The End Behavior of Logarithmic Functions |
|
|
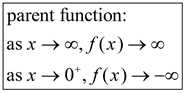
The end behavior of a logarithmic graph also depends upon whether you are dealing with the parent function or with one of its transformations.
• The end behavior of the parent function is consistent.
As x approaches infinity, the y-values slowly get larger, approaching infinity. As x approaches 0 from the right (denoted as
x→ 0+), the y-values approach negative infinity. |
|
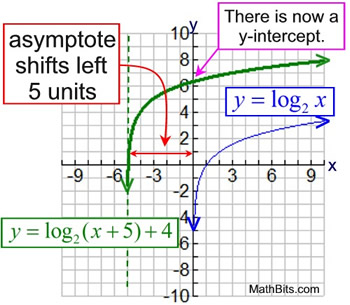
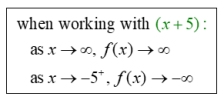
• The end behavior of a transformed parent function is not always consistent, but is dependent upon the nature of the transformation. Consider this example:
|
Find important graphing information at:
|
How to use your graphing calculator for working
with
logarithms
Click here. |
|
|
|
How to use
your graphing calculator for
working
with
logarithms,
Click here. |
|
|

NOTE: The re-posting of materials (in part or whole) from this site to the Internet
is copyright violation
and is not considered "fair use" for educators. Please read the "Terms of Use". |
|