|

The basic method of graphing a straight line is to prepare a table (or T-chart) of x-values and y-values to obtain points, and to plot these points. When dealing with straight lines, with constant (never changing) slopes, only a few points are needed to produce the line.
 Let's review graphing with a table or chart (T-chart): Let's review graphing with a table or chart (T-chart): |
|
|
Choosing Chart Values: Charts typically include, both positve x-values and negative x-values. While choosing only two points will determine a straight line, it is safer to choose at least 3 points. The third point will indicate if an error was made during the calculations of the other two points. |
|
Graph y = 2x + 3
We are going to choose 5 x-values for our chart.
x |
y = 2x + 3 |
y |
-3 |
|
-3 |
-1 |
2(-1) + 3 |
1 |
0 |
2(0) + 3 |
3 |
1 |
2(1) + 3 |
5 |
3 |
2(3) + 3 |
9 |
Plot (x,y) on the coordinate grid. |
|
| |

 |
Remember to include the "completed" graph items:
• labeling the x and y axes
• labeling the scales on the axes (at least to 1 unit on both axes)
•
placing the statement of the equation on the graph.
• using a ruler, straight edge or a folded piece of paper to draw a line. |
Tidbit of information. The x-coordinate may be called the abscissa.
The y-coordinate may be called the ordinate.

| Let's review graphing using the Slope - Intercept Form: |
|
Linear equations often appear in the form y = mx + b. In this form, m is the slope of the line and b is the y-intercept (where the line crosses the y-axis.), thus its name "Slope - Intercept Form".
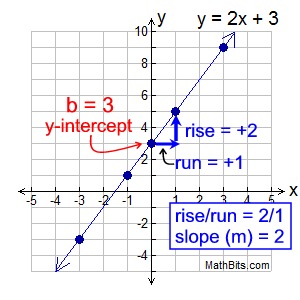
Let's take another look at the example above, y = 2x + 3. |
We can see that y = 2x + 3 is in the Slope - Intercept Form, with m = 2 and b = 3.
y = mx + b
y = 2x + 3
We could have graphed this line without completing a table or chart, by simply using where the line crosses the y-axis and its slope.
Start by plotting the y-intercept (b): b = 3 or (0,3).
Then, from that point, apply the slope (m):
m = 2 or 
|
|
|
Choose a test point: To avoid an error, choose a test point that makes the equation of the line true. That is, when you plug the test coordinates (x,y) into the equation, you get a true result. Plot this test point.
If the test point is on your line, you can be pretty sure your work is correct.
|
|
Test point: For the example above, choose x = -1, which gives y = 1. (-1,1) is on the graph.
Let's look at another example where the form y = mx + b is "hiding". |
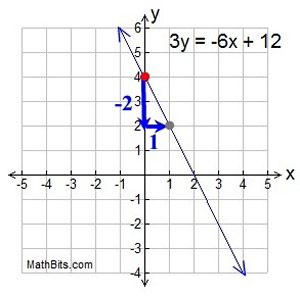
Graph 3y = -6x + 12
At first glance, it appears that this line is not a candidate for the Slope - Intercept Form. But, if we use our algebra skills, we can re-write this equation so that it fits the Slope - Intercept Form of y = mx + b.
We need the equation to be "y = ", not "3y =".
If we divide ALL terms by 3, we will get the equation we need.
y = -2x + 4
We now have the form y = mx + b.
|
|
The y-intercept (b) is +4. Plot this point first, (0,4).
The slope (m) is -2. So the rise/run = -2/1.
Starting at the y-intercept, go down 2 units and right 1 unit. This new location (1,2) is another point on the line. Draw the line.
Test point: Choose x = 2, giving y = 0. The point (2,0) is on the graph.
|
| Using the graphing calculator: |
|

NOTE: The re-posting of materials (in part or whole) from this site to the Internet
is copyright violation
and is not considered "fair use" for educators. Please read the "Terms of Use". |
|