|
When working with real world situations, it may be necessary to graph more than one function equation to represent the conditions in one problem. These multiple function "parts" often arise when two or more differing rates occur over the duration of one problem.
 |
A piecewise-defined function is a function which uses a combination of equations over the intervals of its domain.
(Also called a piecewise function, or a split-definition function.) |
When graphing, the domain is the set of all possible x-coordinates used to create the graph.
The set of all of the y-coordinates used by these
domain elements is called the range.
The "parts" that make up a piecewise-defined functions may be of varying types
(linear, quadratic, exponential, etc.),
or a combination of types.
On this page, we are going to examine only piecewise functions
whose "parts" are linear equations. |
 Piecewise Graphs - Given the Function Definition: |
Graph:
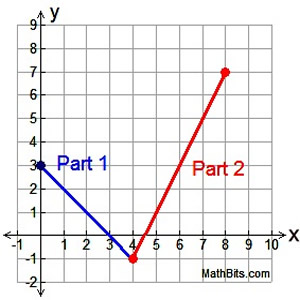
According to the "limitations" placed after each "part" of this piecewise function, we see that this function will start at x = 0 and stop at x = 8. Its domain will be the interval [0,8], all values between 0 and 8 inclusive.
This graph is composed of two linear segments.
In this example, the two "parts" of the graph are joined together at the point (4,-1). The point (4,-1) belongs to Part 2, and is approached by Part 1. |
 |

Let's see a graph where the "parts" are not joined together.
Graph:
The "limitations" placed after each "part" tell us that this function starts at x = -2 and stops at x = 5. Its domain will be the interval [-2,5], all values between -2 and 5 inclusive.
Again, the graph is composed of two linear segments.
In this example, however, the two "parts" of the graph are NOT joined together. You must be careful with such graphs to show an open circle for a "non-included" segment endpoint, and a shaded circle for an "included" segment endpoint. |
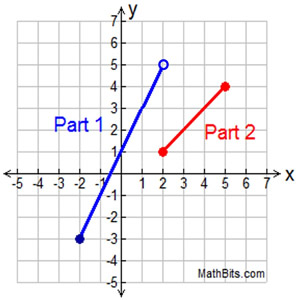 |
 NOTE: In this graph at x = 2, the red endpont at (2,1) is closed (shaded), but the blue endpoint at (2,5) is open (not shaded). If the blue endpoint had been shaded, this graph would no longer be a function. NOTE: In this graph at x = 2, the red endpont at (2,1) is closed (shaded), but the blue endpoint at (2,5) is open (not shaded). If the blue endpoint had been shaded, this graph would no longer be a function.
Functions only allow for ONE y-value to be assigned to each x-value.
A Known Piecewise Graph - Absolute Value: |
The graph of the Absolute Value function is a piecewise function, composed of two linear "parts". The definition of the absolute value function can be translated into a piecewise form:
Our original definition of Absolute Value:
 |
Piecewise definition of Absolute Value
y = | x |
 |
Absolute Value, y = | x |, is a piecewise function.
|
Piecewise Graph - Relating to a Word Problem: |
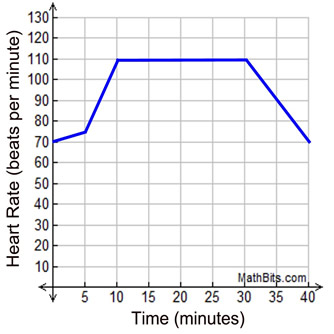
Alan has embarked on an exercise program on his new treadmill. The graph at the right shows his heart rate during one of his daily 40 minute workouts.
1. Write a story that this graph may represent.
Possible answer: Alan starts out with a slow 5 minute warm-up. He then steadily increases his warm-up efforts in the next 5 minutes until he reaches a heart rate of 110 beats per minute. He maintains that rate for 20 minutes, afterwhich he steadily cools down until he returns to his starting heart rate.
2. What was Alan's rate of change during his cool down?
Answer: The cool down started at 110 beats per minute and ended with 70 beats per minute, over a period of 10 minutes.
Alan was cooling down at a rate of -4 heart beats per minute. He was decreasing his heart rate by 4 beats per minute. |
 |
|
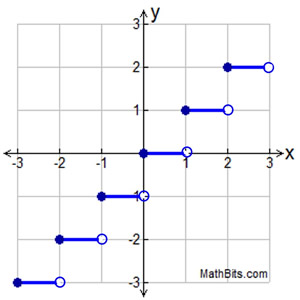
A Specific Piecewise Graph - A Step Function: |
A step function is a function whose graph is a series of line segments, which when graphed resemble small staircase "steps".
One of the most common step functions is the Greatest Integer Function. The Greatest Integer Function's rule is that the y-coordinate is the "greatest integer less than or equal to the corresponding x-coordinate".
If the x-coordinate is an integer, the y-coordinate is that same integer value.
If the x-coordinate is not an integer, the y-coordinate is the next smaller integer (to the left of the x-value on a number line).
Examples: (1, 1) , (-3, -3), (1.5, 1), (-2.4, -3)
Greatest Integer Function notation: y = [ x ].
The graph is shown at the right. |
 |
Piecewise Graphs - on the Graphing Calculator: |
|
For calculator help with Graphing
Piecewise
click here. |
|
|

NOTE: The re-posting of materials (in part or whole) from this site to the Internet
is copyright violation
and is not considered "fair use" for educators. Please read the "Terms of Use". |
|