|
If you can solve a linear equation, you can solve a linear inequality. The process is the same, with one exception ... |
... when you multiply (or divide) an inequality by a negative value,
you must change the direction of the inequality. |

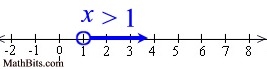
Solve and graph the solution set of: x - 3 > -2 |
Solve as you would a linear equation
(add 3 to both sides of the statement).
The solution set for this problem will be all values that satisfy x > 1.
Graph using an open circle for x =1 (since x can not equal 1), and an arrow pointing to the right. |
x - 3 > -2
x > 1
|
Note: When you finish solving an inequality, you may want to CHECK a couple of values to see if the number line graph is correct. In Example 1, choose 5 from the number line and see if it solves the original inequality. It does (5 - 3 > -2),
It is important to check back to the "original" inequality, just in case you make an algebraic error.
You can also check values to the left of 1 on the number line to see that they do NOT solve the original inequality.
Solve and graph the solution set of: x + 5 < 8 |
Solve as you would a linear equation
(subtract 5 from both sides of the statement).
The solution set for this problem will be all values that satisfy x < 3.
Graph using a closed circle for x = 3 (since x can equal 3)., and an arrow pointing to the left. |
x + 5 < 8
x < 3
|
Solve and graph the solution set of: 4x < 24 |
Again, proceed as you would when solving a linear equation:
Divide both sides by 4.
Note: The direction of the inequality stays the same since we did NOT divide by a negative value.
Graph using an open circle for 6 (since x can not equal 6) and an arrow to the left (since our symbol is less than). |
|

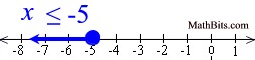
Solve and graph the solution set of: -5 x  25 |
Divide both sides by -5.
Note: The direction of the inequality was reversed since we divided by a negative value.
Graph using a closed circle for -5 (since x can equal -5) and an arrow to the left (since our final symbol is less than or equal to). |
|
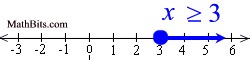
Solve and graph the solution set of: 3x + 4 > 13 |
Proceed as you would when solving a linear equation:
Subtract 4 from both sides.
Then, divide both sides by 3.
Note: The direction of the inequality stays the same since we did NOT divide by a negative value.
Graph using an open circle for 3 (since x can not equal 3) and an arrow to the right (since our symbol is greater than). |
|
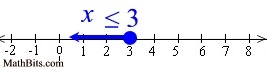
Solve and graph the solution set of: 9 - 2 x  3 |
Subtract 9 from both sides.
Then, divide both sides by -2.
Note: The direction of the inequality was reversed since we divided by a negative value.
Graph using a closed circle for 3 (since x can equal 3) and an arrow to the right (since our symbol is greater than or equal to). |
|
For the following problems, alternate forms of expressing the solutions are included.
For more information on "alternate notations", see
Notations for Solutions.
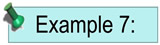
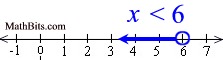
Solve and graph the solution set of:  |
Proceed as you would when solving a linear equation with a fraction:
Add 6 to both sides.
Multiply both sides by  .
Note: The direction of the inequality stays the same since we did NOT multiply by a negative value.
Graph using a closed circle for 6 (since x can equal 6) and an arrow to the left (since our symbol is less than or equal to).
|
Other notations:
|

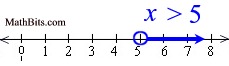
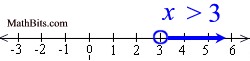
Solve and graph the solution set of: 5(x - 3) > 10 |
Distribute (remove the parentheses).
Add 15 to both sides.
Divide both sides by 5.
Note: The direction of the inequality stays the same since we did NOT multiply by a negative value.
Graph using a open circle for 5 (since x can NOT equal 5) and an arrow to the right (since our symbol is greater than). |
Other notations:
 |

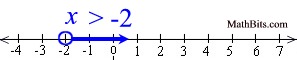
Solve and graph the solution set of: 4(x - 1) > 3(x - 2) |
Distribute across both sets of parentheses.
Subtract 3x from both sides.
The solution is easier if you move the smaller x value.
Add 4 to both sides.
Note: The direction of the inequality stays the same since we did NOT multiply or divide by a negative value.
Graph using an open circle for -2 (since x can not equal -2) and an arrow to the right (since our symbol is greater than). |
Other notations:
 |
|