|
 NY NGMS limits use to a > 0 for the following definition. NY NGMS limits use to a > 0 for the following definition.
 |
An exponential function is a function having a positive constant as its base and a variable as its exponent (or part of its exponent). |
| |
Form: f (x) = a(b)x where a is a real number,
b is positive (b ≠1), and x is a real variable.
May also be written as:
f (x) = abx
When a = 1, it is written as: f (x) = bx
Note: a = y-intercept or the beginning value
b = growth factor (b > 1), or decay factor (0 < b < 1) |
|
• The independent variable is the exponent in these functions.
• If b = 1, the result is a horizontal straight line (a constant function)
which does not possess the properties of growth or decay of an exponential function.
• The base b of the function cannot be negative, as complex numbers may result. (-4)½=2i
An exponential function with base b is defined by f (x) = a(b)x
as stated above, and x can be any real number.
The base, b, is constant and the exponent, x, is a variable.
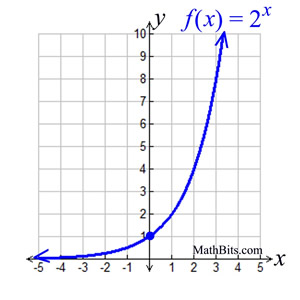
In the following example, a = 1 and b = 2.
 |
x |
y = f (x) |
-2 |
2-2 = ¼ |
-1 |
2-1 = ½ |
0 |
20 = 1 |
1 |
21= 2 |
2 |
22 = 4 |
3 |
23 = 8 |
|
Shape: Most exponential graphs will have this same arcing shape.
Rate of Change:
This graph does not have a constant rate of change, but it has constant ratios. It is growing by common factors over equal intervals. |
Features (for this graph):
• the domain is all Real numbers.
• the range is all positive real numbers (not zero).
• graph has a y-intercept at (0,1). Remember any number to
the zero power is 1.
• when b > 1, the graph increases. The greater the base, b,
the faster the graph rises from left to right.
• when 0 < b < 1, the graph will decrease.
• has an asymptote (a line that the graph gets very, very close
to, but never crosses or touches). For this graph the
asymptote is the x-axis (y = 0).
|
|
 As x increases by +1, As x increases by +1,
y increases by x 2.
|
|
|
|
|
The value of b (the 2) may be referred to as the "common factor", or the "multiplier".
It may also be referred to as the "ratio" of successive terms.
Exponential functions grow by common factors over equal intervals. |
Most exponential graphs resemble this same basic shape. Notice the y-values of the graph are very, very small on its left side making it extremly close to the x-axis. As the x-values increase to the right, the graph's y-values grow faster and faster, shooting quickly off the top of the graph.
This graph depicts exponential growth.
NOTE: In a linear graph, the "rate of change" remains the same across the entire graph.
In an exponential graph, the "rate of change" increases (or decreases) across the graph.
FYI: The exponential graph, y = bx, passes through the points (-1, 1/b), (0,1), and (1,b)
For this graph, those points are (-1, ½), (0, 1). and (1, 2).
|
Exponential functions are very "dramatic" functions
in relation to the speed at which they increase (or decease). |

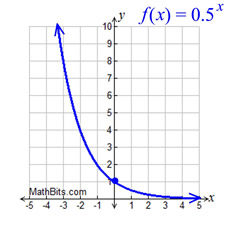
Graph with 0 < b < 1.
Each time x in increased by 1,
y decreases to ½ its previous value. |
Exponential graph (0 < b < 1)
This graph depicts exponential decay.
f (x) = 0.5x
Since b = 0.5, the graph decreases from left to right.
• the domain is all Real numbers.
• the range is all positive real numbers, y > 0.
• graph has a y-intercept at (0,1).
• the asymptote is the x-axis (y = 0)
This graph passes through the points
(-1, 2), (0, 1). and (1, ½).
|
 |
HINT: Due to the speed at which exponential graphs grow, you may need to adjust the viewing window on your graphing calculator to see more of your graph. (window settings)
You may want to increase the y-scale. |

NOTE: The re-posting of materials (in part or whole) from this site to the Internet
is copyright violation
and is not considered "fair use" for educators. Please read the "Terms of Use". |
|