Answer to Question 10
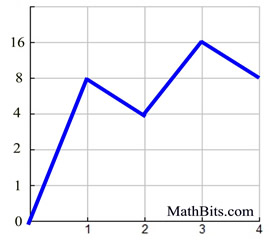
ANSWER: There are no labels to show what the graph represents.
The vertical (left-sided) scale does not increase in even increments. These jumps in scale sizes create a misleading appearance to the graph. The visual appearance of the graph implies that the largest increase occurred between 0 and 1 (on the horizontal axis), when in reality the largest increase occurred between 2 and 3 (on the horizontal axis). Not a good graph.
All Rights Reserved - Copyright MathBitsNotebook.com