|
Directions: Read carefully.
1. |
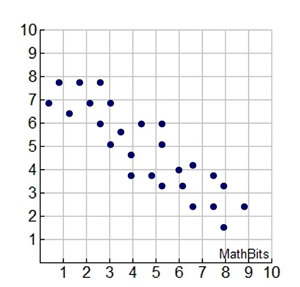
A scatter plot is shown in the coordinate plane.
Which of the following graphs most closely approximates a line of best fit for the data in this scatter plot? |
 |
|
|
2. |
Which statement is true about the data in a scatter plot where the y-values are decreasing as the x-values are increasing?
Choose:
|
|
|
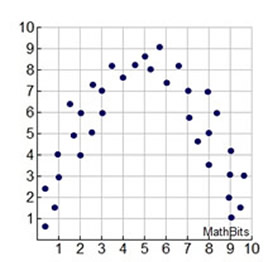
3. |
A scatter plot of data is shown at the right. Which association (correlation) best describes the data?
Choose:
|
|
|
|
4. |
The table below shows the relationship between total fat grams and the total calories in a selection of fast food sandwiches. This data can be modeled by the line y = 13x + 143, where x is the total fat in grams and y is the total calories.
|
| |
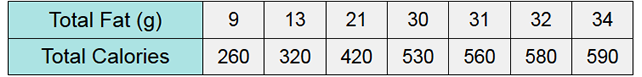
Based upon the model equation, what is the best prediction of the total calories for a sandwich with 36 total grams of fat?
Choose:
|
|
5. |
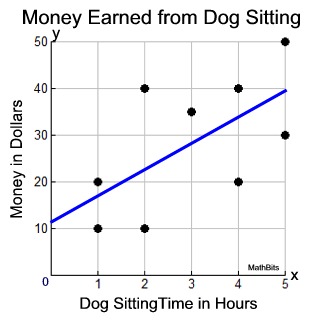
The number of hours spent dog sitting and the amount of money earned is plotted at the right. The line of best fit has the equation y = y = 5.5x + 11.8.
Which of the following statements can be considered a valid prediction based upon this data?
|
 |
| |
Choose:
|
|
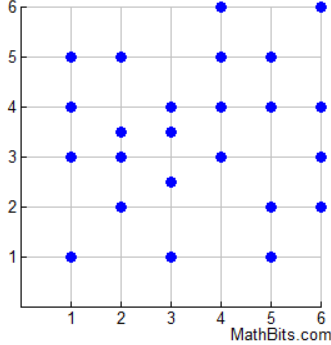
6. |
A scatter plot of data is shown at the right. Which association (correlation) best describes the data?
Choose:
|
|
|
|
7. |
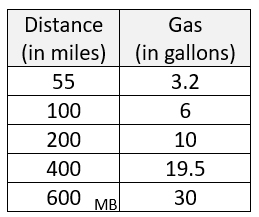
The table shows the number of gallons of gasoline used during five vacation related trips. (x = miles, y = gallons)
The line of best fit is
y = 0.05x + 0.63.
Using the equation, estimate to the nearest mile, the number of miles that you could expect to drive using 100 gallons of gasline.
|
 |
| |
Choose:
|
|
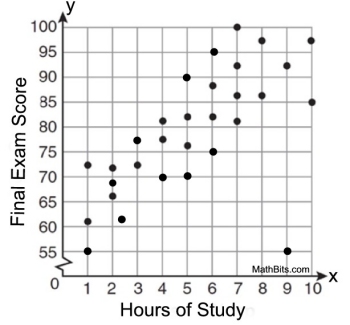
8. |
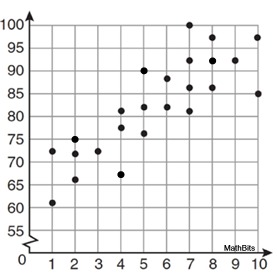
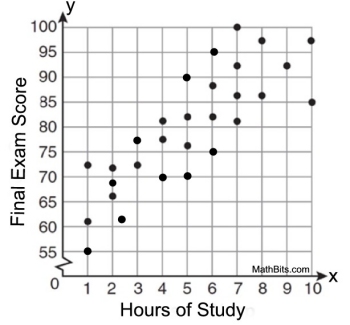
A scatter plot of data is shown at the right. Which statement best describes the association between hours of study and final exam scores?
Choose:
|
|
|
|
9. |
Data is randomly collected from students regarding the number of hours they studied before the final exam, and their scores on the exam.
The scatter plot displays the data.
The line of best fit has the equation y = 3.7x + 61.6.
Which of the following statements best describes what the slope and y-intercept of the equation represent?
|
 |
| |
Choose:
|
|
10. |
Which equation best models this set of data?
Choose:
|
|
|
|

NOTE: The re-posting of materials (in part or whole) from this site to the Internet
is copyright violation
and is not considered "fair use" for educators. Please read the "Terms of Use". |
|