|
A z-score (or standard score) represents the number of standard deviations a given value x falls from the mean, μ. |
|
A z-score is a measure of position that indicates the number of standard deviations a data value lies from the mean. It is the horizontal scale of a standard normal distribution.
The z-score is positive if the value lies above the mean, and negative if it lies below the mean. To calculate a z-score, the population mean and standard deviation must be known.
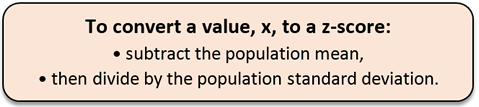 |
Z-score Calculation:
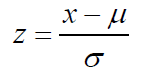
• value being examined x
• population mean μ
• population standard deviation σ
|
 Round z-scores to two Round z-scores to two
decimal places. |

Remember that z-scores tell us how far a value is from the mean. When you " standardize" a variable, its mean becomes zero and its standard deviation becomes one. 
AREA under a Normal Curve: |
|
Areas under all normal curves are related. For example, the area percentage to the right of 1.5 standard deviations above the mean is identical for all normal curves. (The term "area" will refer to "area percentage".) |
|
The fact stated above is the reason we can find an area over an interval for any normal curve by finding the corresponding area under a standard normal curve (with a mean of 0 and a standard deviation of 1).
We have seen that the Empirical Rule (68% - 95% - 99.7%) subdivides the area under a normal distribution into sections with widths of one standard deviation. These subdivisions are fine for determining percentages as long as we are dealing with values that fall at these exact subdivision locations.
What do we do when the value does not fall at an Empirical Rule subdivision? By using z-scores, we have the ability to locate a percentage (or area) under a standard normal distribution at any location. Z-scores allow for the calculation of area percentages (also called proportions or probabilities) anywhere along a standard normal distribution curve (and, consequently along the corresponding normal distribution).
The area percentage (proportion, probability) calculated using a z-score will be a decimal value between 0 and 1, and will appear in a Z-Score Table. The total area under any normal curve is 1 (or 100%). Since the normal curve is symmetric about the mean, the area on either sides of the mean is 0.5 (or 50%).
To find a specific area under a normal curve, find the z-score of the data value and use a Z-Score Table to find the area. A Z-Score Table, is a table that shows the percentage of values (or area percentage) to the left of a given z-score on a standard normal distribution.
|
You need both tables!
• These tables are designed only for the standard normal distribution,
which has a mean of 0 and a standard deviation of 1.
• The left most column is how many standard deviations above (or below) the mean to one decimal place. (The label in the row contains the integer part and the first decimal of the z-score.)
• The part of the z-score denoting hundredths is found across the top row of the table. (The label for columns contains the second decimal of the z-score.)
• The intersection of the rows and columns gives the probability or area under the normal curve. Each value in the body of the table is a cumulative area.
 Z-Score Tables come in different formats, determined by where the computations were started. Consider these two most popular formats: Z-Score Tables come in different formats, determined by where the computations were started. Consider these two most popular formats:
1. One form of the table yields probability or area starting at the mean and going to the right of the mean up to the needed z-score. These tables are usually labeled "cumulative from mean". This table basically works with half of the area under the normal curve, and the user must take this into consideration and make adjustments when using this table. This type of table lists positive z-scores only.
2. Another form of the table yields probability or area starting from negative infinity (the farthest left) and going to the right up to the needed z-score. These tables are usually labeled "cumulative from the left". This table works with the entire area under the normal curve, and requires less adjustments than the first option. This table lists both positive and negative z-scores. Most beginning statistical textbooks include this Z-Score Table, and this site will be using this format.
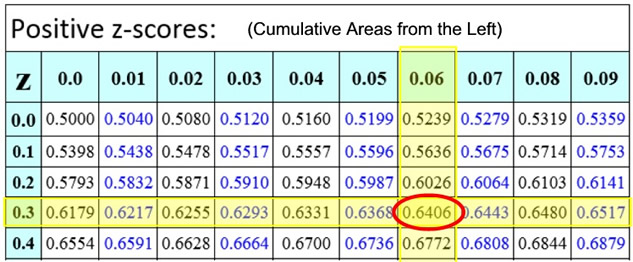
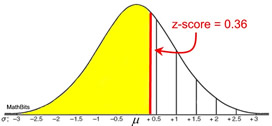
| Example 1: Find the probability that a variable has a z-score of less than 0.36. |
Solution: Find the z-score in the table below. The intersection shows 0.6406. The probability is 64.06% (or the area percentage of the yellow region is 0.6406). |
 |
|
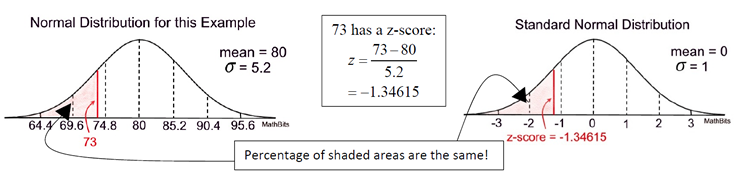
Example 2: A normally distributed population of test scores has a mean of 80 and a standard deviation of 5.2.
a) Find the percentage of scores that lies below 73. |
|
Start by setting up a sketch of the situation. This will give you a better understanding of where your values lie and whether your final answer will be reasonable. Remember that the area under a normal curve is read as an accumulation starting from the left side of the graph.
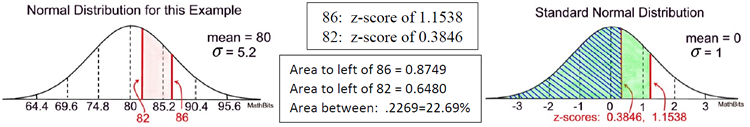
b) Find the percentage of scores that lies between 82 and 86. |
To find the percentage of the area between two values, such as 82 and 86, find the z-scores for each value. From the Z-Score Table, find the area to the left of 86 and subtract the area to the left of 82.
c) Find the percentage of scores that lies above 73. |
To find the percentage of the area that lies "above" the z-score, take the total area under a normal curve (which is 1) and subtract the cumulative area to the left of the z-score.
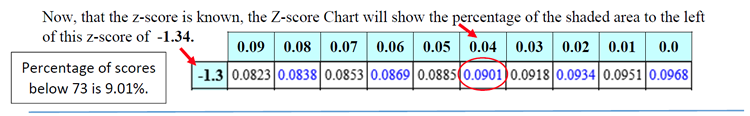
In part a, 73 had a z-score of -1.34615 with a cumulative area to the left of 0.0901 or 9.01%.
The area to the right of this z-score will be 1 - 0.0901 = 0.9099 or 90.99%.
 The need for finding percentages (proportions, areas) associated with z-scores manually, including use of the Z-Score Tables, can be avoided if you know how to use your graphing calculator. You can see an example of a problem solved using the calculator under Normal Distributions. For directions on using the graphing calculator (TI-84+ family), see Normal Distribution and the Calculator. The need for finding percentages (proportions, areas) associated with z-scores manually, including use of the Z-Score Tables, can be avoided if you know how to use your graphing calculator. You can see an example of a problem solved using the calculator under Normal Distributions. For directions on using the graphing calculator (TI-84+ family), see Normal Distribution and the Calculator.
Be careful! You may be asked to determine this information with, and without, the use of a calculator, so be ready.
|
|