We know that a line graph can be used to represent a wide range of real world data.
But, dealing with real world data, can introduce some situations that don't quite "fit" into being represented by the entire plotting of a straight line.
It is possible that certain solutions which make an equation true mathematically,
may not make any sense in a real-world context.
|
Constraints are restrictions (limitations, boundaries) that need to be placed upon variables used in equations that model real-world situations. |
Mathematically:
Consider the line: y = 65x
where x can be any real number, including negative values.
Real-world:
If y = 65x is used to model the distance traveled, y,
at a speed of 65 mph for x hours,
x cannot, realistically, be a negative number of hours. |

Constraint: x > 0 |
|
Constraints are generally placed
on the x-values
(the independent variable) in
an equation or function.
When graphing, the set of all "possible" x-coordinates used to create the graph are referred to as the domain. The domain will reflect any constraints that may be needed in a particular situation.
The set of all of the y-coordinates used by the
domain elements is called the range.
|
Linear Equation:
It is discovered that the college registration process for Professor Smith's Calculus class can be modeled by the equation y = 2x + 12, where y = the number of students registered at the end of each day, and x = the day of registration. Professor Smith has 12 students pre-registered before the registration process begins, and the registration closes after 7 days.
While it can be said that y = 2x + 12 models the registration process for this Calculus class, you can see that the "real" model is only a portion of this straight line. There are no "negative" days for the registration process, and there are no days beyond Day 7 for registration.
A better model is an equation with constraints:
 |
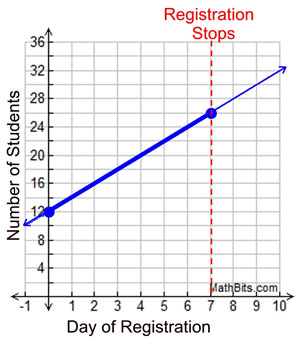
Domain:
0 < x < 7 Range: 12 < y < 26 |
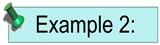
Quadratic Equation:
A ball is dropped from 40 feet above the ground. As the ball falls to the ground, in a straight drop, its height above the ground, as time passes, is modeled by the equation y = -16x2 + 40, where
y = the height above the ground in feet and x = time in seconds.
While it can be said that y = -16x2 + 40 models the fall of the ball, you can see that the "real" model is only a portion of this quadratic graph. There are no "negative" seconds of time, and there are no heights below ground level.
The ball hits the ground after approximately 1.6 seconds, which is the end of its fall.
A better model is an equation with constraints:
 |
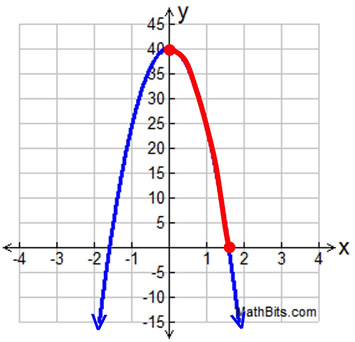
Domain:
0 < x < 1.6 Range: 0 < y < 40
|
|